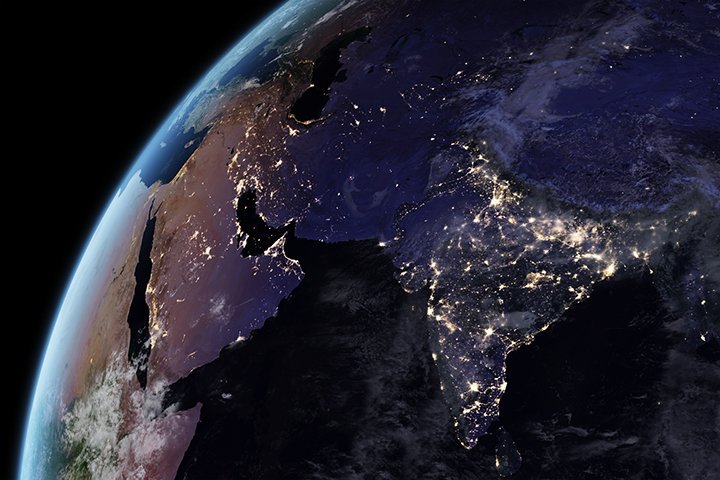
NASA scientists on Thursday released new global maps of Earth at night, providing the clearest yet composite view of the patterns of human settlement across our planet.
Satellite images of Earth at night – often referred to as “night lights” – have been a source of curiosity for public and a tool for fundamental research for nearly 25 years.
They have provided a broad, beautiful picture, showing how humans have shaped the planet and lit up the darkness.
Produced every decade or so, such maps have spawned hundreds of pop-culture uses and dozens of economic, social science and environmental research projects.
Now, a research team led by Earth scientist Miguel Roman of NASA’s Goddard Space Flight Centre in the US plans to find out if night lights imagery could be updated yearly, monthly or even daily.
In the years since the 2011 launch of the NASA-NOAA Suomi National Polar-orbiting Partnership (NPP) satellite, researchers have been analysing night lights data and developing new software and algorithms to make night lights imagery clearer, more accurate and readily available.
They are now on the verge of providing daily, high- definition views of Earth at night, and are targeting the release of such data to the science community later this year.
Since researchers from the National Oceanic and Atmospheric Administration and NASA released a new Earth at night map in 2012, Roman and teammates at NASA’s Earth Observing Satellite Data and Information System (EOSDIS) have been working to integrate nighttime data into NASA’s Global Imagery Browse Services (GIBS) and Worldview mapping tools.
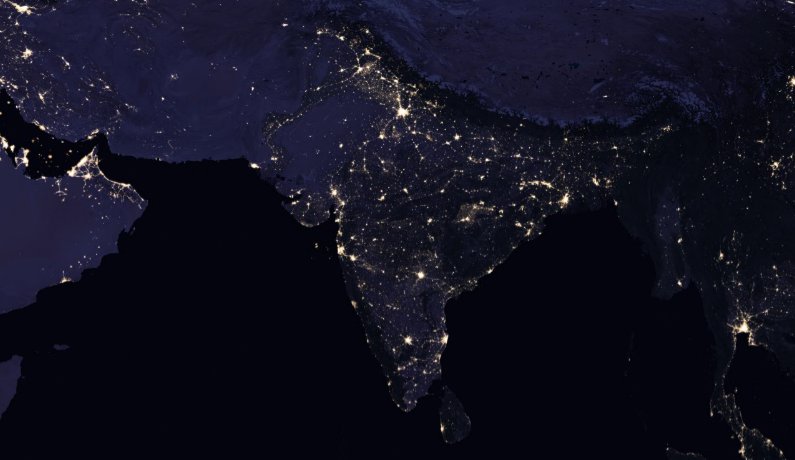
The new global composite map of night lights was observed in 2016. The NASA group has examined the different ways that light is radiated, scattered and reflected by land, atmospheric and ocean surfaces.
The principal challenge in nighttime satellite imaging is accounting for the phases of the moon, which constantly varies the amount of light shining on Earth, though in predictable ways.
Likewise, seasonal vegetation, clouds, aerosols, snow and ice cover, and even faint atmospheric emissions (such as airglow and auroras) change the way light is observed in different parts of the world.
The new maps were produced with data from all months of each year. The team wrote code that picked the clearest night views each month, ultimately combining moonlight-free and moonlight-corrected data.
New satellite images of Earth at night give the clearest view of the patterns of human settlement across our planet: https://t.co/Es76CCQGMa pic.twitter.com/uMzUz2aYOf
— NASA (@NASA) April 12, 2017